Build Dashboards With Google Sheets
Pricing
from $199
- Contact Vendor
Description
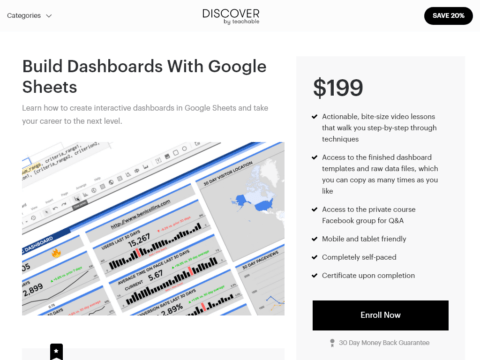
Build Dashboards With Google Sheets
By Ben Collins
Learn how to create interactive dashboards in Google Sheets and take your career to the next level.
What are dashboards?
Dashboards are high-level summaries of your organization’s data, displayed side-by-side in a single page to highlight the key metrics and trends at a glance. They’ll help you:
- Quickly understand the pulse of your business
- Visually summarize key metrics for stakeholders who don’t have time to review the data
- See new insights with your data side-by-side
- Explore the data with interactive features
- Speed up and automate your reporting pipeline
Here’s how you might use dashboards:
- Show growth of your website or clients’ websites, by tracking traffic and social media metrics over time.
- Understand your business better by collecting and analyzing user data in real-time.
- Compare sales data across different time periods, sales channels or geographic regions to get deeper insights into your opportunities.
- Measure student attendance and performance to easily see where to allocate resources.
- Track and visualize financial data to uncover high- and low-performxing areas of your company, so you can make adjustments going forward.
Who is this course for?
- Anyone who works with data in Google Sheets.
- Someone who is curious to learn more about Google Sheets and dashboards.
- Maybe you’re a data analyst, a technical marketer, an educator, a scientist or someone in between.
- Anyone who wants to add new a skill, building dashboards, that will help you advance your career.