FusionCharts
Pricing
from $499
- Monthly Subscription
Description
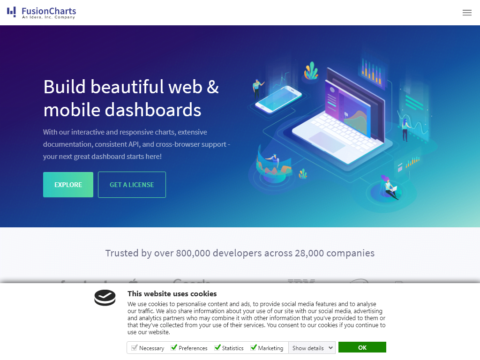
Build beautiful web & mobile dashboards
With our interactive and responsive charts, extensive documentation, consistent API, and cross-browser support – your next great dashboard starts here!
Whether you are building a dashboard for desktop or mobile, with simple or complex data, FusionCharts has you covered
FusionCharts Suite
Beautiful charts and maps for your dashboards
Get over 100+ charts, graphs and gauges along with 2000+ choropleth maps and take your dashboard to a whole new level
FusionTime
Powerful time-series and stock charts for you
From IoT to stock market, render thousands of data points in modern browsers, without a glitch for your next-generation dashboards
FusionExport
Export your entire dashboards, not just charts
Allow users to export entire dashboards as PDF, or send a live copy of the dashboard to their emails
00+ Interactive Charts & 2,000+ Data-driven Maps
Get all the variations of popular charts like Bar, Column, Line, Area, and Pie; or domain-specific charts like Treemaps, Heatmaps, Gantt Charts, Marimekko Charts, Gauges, Spider Charts, Waterfall Charts, and many more! In addition to charts, we also have over 2000+ choropleth maps which cover countries, counties and even cities!
Column Chart
Sankey
Chord
World Map with Drilldown
Angular / Dial Chart
Radar / Spider Chart
Box & Whisker Chart
High-performance time-series charts for ‘big data’ dashboards
Want to visualize data every millisecond for your financial application? Or visualize thousands of sensor data for your IoT application? The time-series chart has it all covered. Render thousands or even a million data points in the browser.
Why should you choose FusionCharts products?
There are over 800,000 developers from 28,000+ companies prefer FusionCharts products over Open source or other paid libraries. Here are a few reasons:
FusionCharts librariesVS Open Source charting libraries
15 minutes to first chart, without any learning curve. Plus, consistent API across different charts make it simple to build complex charts or dashboards.
Some of these libraries have a deep learning curve, requiring days of learning, before you can even build your first chart. And then configuring them to suit your requirements is another story in itself!
Consistent look & feel. Our themes have a consistent look across products. Did we tell you that you can also build your own theme?
Many libraries do not provide a consistent look and feel across the charts. This problem is made worse when you use multiple libraries.
Various installation options available (direct JavaScript, CDN, NPM) and pre-integrated with all popular JavaScript libraries and back-end programming languages
Non availability for all frameworks – Very few libraries officially support plugins for your frameworks and back-end languages.
Comprehensive documentation for each library or programming language, with a lot of live-examples.
While these libraries have simple tutorials that help you get started, but beyond that you’re expected to jump straight to API docs or even source code, without enough examples.
Ready-to-use chart examples, industry-specific dashboards and even data stories, available with source code for you to quickly get started.
These libraries do showcase their charts and features, but most of them do not have examples of integrated dashboarding experience.