OfficeReports
OfficeReports
Pricing
- Monthly Subscription
Description
Data Analysis in Excel
OfficeReports Calculo, our crosstab tool, helps you analyze raw data (e.g. SPSS, Excel, CSV, SurveyMonkey) right inside Excel. Calculo can handle very large data sets and has advanced statistical functionality like significance tests, weighting, correlation etc.
Data Visualization in PowerPoint
OfficeReports Presento speeds up the creation of reporting slides by linking Excel data ranges to PowerPoint tables, charts, shapes and infographics like sliders and Gauge charts. Presento consists of a simple ribbon tab in PowerPoint, plus an integrated Excel task pane.
All in One: Intelligo
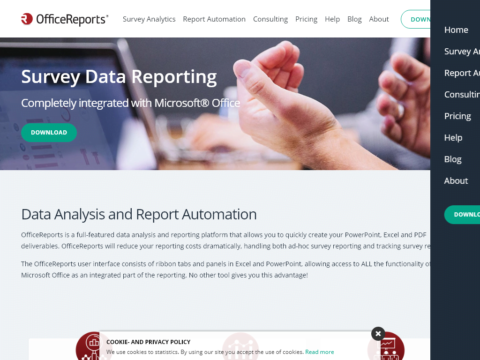
OfficeReports Intelligo is a complete data analysis and visualization platform that quickly allows users to create common data deliverables. A perfect solution for all reporting from quick ad-hoc surveys to large international tracking studies (report automation).
Why OfficeReports?
OfficeReports is not like other crosstab and data visualization tools:
Completely integrated with Microsoft® Office
OfficeReports is the only solution allowing access to ALL the functionality of Microsoft Office as an integrated part of the reporting.
Save time and reduce errors
By automating the generation of tables, slides and even complete survey reports, OfficeReports speeds up analysis and visualization, taking a fraction of the time spent when using traditional methods.
Report Automation
OfficeReports has functionality for tracking survey reporting and mass generation of reports. Clever filtering enables automation of even the most complex reports.
CASE STUDY: SYNDICATED RESEARCH
Syndicated Major information provider uses OfficeReports to automate an industrial-scale reporting operation

